Electrical frequency and electrical intensity are two variables within EMS that play a very important role.
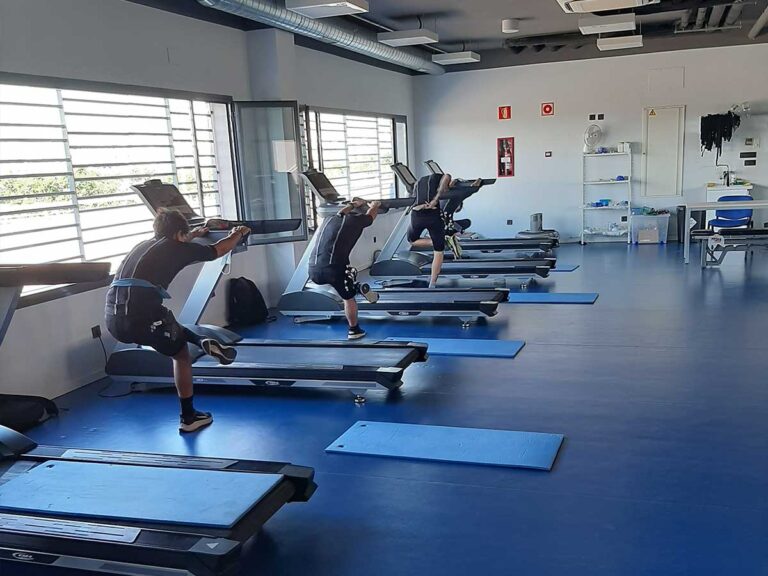
The study we have carried out at Wiems Lab aimed to analyze the drift in heart rate with two different electrical frequencies (7 Hz and 21 Hz); however, we evaluated other variables that may explain why the drift is different in some participants or at some frequency.
Thus, at each moment of the evaluation, note was taken of the electrical intensities in mA and they were compared with each other. Thanks to the collaboration carried out with the University of Granada and with the Profith team, we have the best tools for the evaluation and subsequent analysis of electrical intensities.
The evaluation protocol for this cross-sectional study can be found in this post and, if you are interested in seeing how heart rate fluctuates by individual and by frequency, do not hesitate to read the post “How much can heart rate vary in training with EMS” and post “What happens to the heart rate when 7Hz and 21 Hz are applied in different order”.
Before continuing with the evaluation of these electrical parameters, it is important that we establish the differences between them, and talk about other variables that were also measured:
- Electrical frequency: The electrical frequency is the number of impulses per second offered by whole body electrostimulation (WB-EMS)
- Electrical intensity: Electrical intensity is the amount of electrical impulse that is transported from the Wireless device to the muscles.
- RPE: It is the subjective perception of effort. We wanted the person to have 3 different sensations: 5/10, 7/10 and 8/10. The RPE scale is not related to the EMS, but it helps us to know if the effort we are demanding is very strong or not. On a scale where 0 is no intensity and 10 is super intense, we look for values of 5, 7 and 8.
Having clarified these terms, the objective of today’s study is to evaluate the relationship between electrical intensity (measured in milliamps per muscle), the increase in heart rate, and the frequencies of 7 Hz and 21 Hz.
Assessment
The evaluation of this variable and its relationship with heart rate has been difficult because each muscle group can have a different intensity, and with the idea of being able to offer the coach information that can help him tomorrow, the analysis of this variable has required the creation of specific databases.
5/10 RP scale
Thus, below, we present the data treated on electrical intensity supported by muscle group at an RPE of 5/10 in the 2 electrical frequencies (7 Hz and 21 Hz):

The graphs show the values obtained by each participant (balls) and the average of all of them (column). Thus, we can see how at 21 Hz the height of the columns is much less than at 7 Hz. On the other hand, we can see on the right the average for each muscle group at 7 Hz and the same value for 21 Hz.
We see in all muscle groups that the average electrical intensity drops to 21 Hz. This makes a lot of sense, since when we increase the number of electrical impulses per second, the contraction is much greater and the sensation is much more uncomfortable.
It should be noted that in muscles such as the triceps we can see 1 or 2 little balls. This is because during this intervention two different suits were used to check if there was any difference between them. We use the Slim Plus personal EMS suit and the Wiemspro Revolution Pro shared use EMS suit.
7/10 PR scale
In the same way that we carried out an analysis of the electrical intensity at an RPE scale of 5/10, it was also done at 7/10. In the following image we have the result:

If we compare these latest data with the previous ones (5/10), we logically see that the values have increased both at 7 Hz and at 21 Hz. The RPE comfort scale allows us to increase the intensity of the participants and achieve the proposed objective.
At this electrical intensity, participants usually show medium comfort that allows them to continue doing the exercise for approximately 30 minutes. It is important to know this value, since each participant has a different feeling with EMS because our objectives mark the type of training that we must carry out, but so does the self-perception of the participant.
At this intensity, we continue to observe that the columns formed at 21 Hz are smaller than those at 7 Hz. This means that at 7/10 RPE there is still a lower electrical intensity at 21 Hz than at 7 Hz.
RP 8/10 scale
Finally, we present what happens at an RPE scale of 8/10:

The trend in this case remains the same. This RPE is usually located at a point below discomfort, since the RPE is accompanied by an electrical intensity that represents a fairly high muscle contraction, and which is accompanied by an increase in heart rate.
We could not say that these intensities are comfortable. In fact, the degree of comfort decreases in quantity at these intensities, but the application of EMS at 8/10 is not usually prolonged.
In order to evaluate this increase in frequency, Wiems Lab has designed some templates that help us collect data and disseminate and understand the results. Thus, for example, in the following image we find a summary of the sessions that the participants proposed and their evolution:
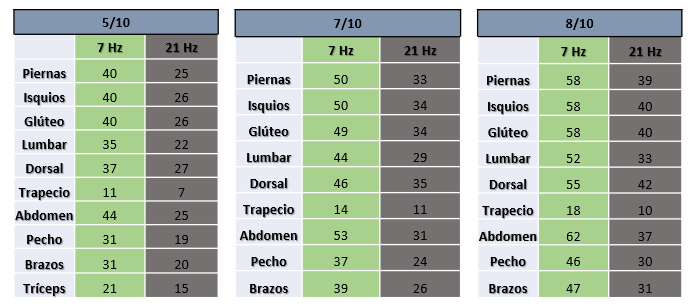
First we are going to present the electrical current data for each RPE and at each frequency to visualize the increase in intensity. In the image we can see first that the increase in electrical intensity is linear as we increase the RPE perception, and second that the electrical intensity at 21 Hz is always less than at 7 Hz.
On the other hand, it is really interesting to relate these increases in electrical intensity with increases in heart rate. Thus, we can perform a correlation of both variables, and approximate the increase in heart rate expected for a specific increase in electrical intensity. From Wiems Lab we have carried out a specific analysis relating both variables. This is the result:

In the image we can see the average heart rate that occurs at the 4 marked intensities (Without EMS 5/10, 7/10 and 8/10) and the average electrical intensities used for each muscle group. We see the increase in heart rate that occurs at each RPE scale compared to the heart rate without EMS; and we see the increase in electrical intensity in mA for each muscle group compared to the intensities at 5/10. So an increase of 20 mA for each muscle group could increase 49 bpm. Of course, these data are averages of all the participants and each case may be different; however, this approach can be very useful for knowing how to train.
For example, it is extremely comfortable to know that if I want to reach a higher heart rate in a shorter period of time, I will have to increase the electrical intensity up to 20 mA, and train in that zone.
* It is important to emphasize that these data that we observe in the image pass with 7 Hz and are not valid for any other electrical frequency.
Our goal is to provide tools to coaches that facilitate their work and that allow them to keep safe and effective control of their trainees.
Management of electrostimulation during the process
The research carried out at the Wiems Lab aimed to elucidate the relationship between an increase in electrical intensity and an increase in heart rate at two different frequencies.
In this sense, it is important to highlight that the EMS was administered by a person specialized in EMS training, and by a person with knowledge of response to exercise, exercise physiology, and safety in the application of EMS.
This tool is really useful when it comes to increasing heart rate and improving muscle tone and response; however, EMS can be a dangerous tool when not administered by a trained person. As we know, EMS is capable of involuntarily contracting a large number of muscle groups thanks to the administration of electrical charge. That is why we must pay extreme attention so as not to cause damage or harm to the trained person. If you want to certify yourself as a specialized electrostimulation trainer, visit our online courses section and get certified now!
Conclusion
This study has been carried out on middle-aged men. The results cannot be extrapolated to another set of society as a precaution; however, we can conclude that:
- Withstand currents are inversely proportional to the frequency used.
- The higher the frequency, the lower the intensity for all levels of EMS 5, 7 and 8 out of 10.
- Knowing the effects of EMS on heart rate, it may be interesting to use low frequencies with high intensities for a short period of time (10-15 minutes) followed by work at a higher frequency and with less intensity.
In the following studies we will look at the relationship between increased heart rate and substrate oxidation to give more detailed advice on the administration of electrical current during low-intensity elliptical exercise.
Unai Adrian Perez de Arrilucea
Wiems Lab Team

